Tuesday, April 17, 2012

Map of Historical and Influencial Protests in Los Angeles


View Places of Protests in LA in a larger map

Neogeography allows people to create and manipulate maps. While using this neogeographical tool, I notice that there may be limitations and consequences to neogeography. Combining different geographic mapping tools, anyone can create a map that suits them. It is a great way for people to interact with maps.
Neogeography is highly dependent of the original maps. Maps can become outdated and the accuracy might not be certain. Streets, buildings, and geographic landmarks have changed. For example, Google Earth might run into problems because the data they use are dated a few years ago. As a public tool, anyone can create neogeographic maps of their choice. This potentially creates a misleading documentation of places. People can create their own maps, which might show false and incorrect information.
As Los Angeles’ demographics and urban structures change over periods of time, it begins to decentralize. In this decentralization of Los Angeles, there becomes no central place to gather and protest. Unlike metropolitan areas like New York and San Francisco, Los Angeles has a lack of places to mobilize and get together. We should ask ourselves why people would want to protest in the first place. The history of Los Angeles possesses many inequalities of public uses of space. Protests have long been a way in which disenfranchised and voiceless people can get across what they believe in. In doing so, protests become either structured or unstructured, with different goals. These many goals can be connected to understanding the conditions of the demonstrators at the specific time/period.
In examining different protest situations and sites, such as Pershing Square, the Rodney King incident, Florence & Normandie, Justice for Janitors at USC and Olympic Boulevard in Century City, we can see the connection between inequality and space. This stems from the change in demographics—for example, with increasing immigrant populations and the labor force. Sparking the Rodney King incident is the many social inequalities happening around that time. The Florence & Normandie incident was an event that followed the Rodney King incident; it relates to the anger from injustices and inequality. The USC and Olympic Boulevard in Century City Justice for Janitor events originated in response to the inequality within the workplace. Pershing Square reminds us that people come together to bring about a cause; as one of the first and last open/public places of protest in Los Angeles, it has served as a hub for the fight about inequality in the workplace, politics, and much more. Los Angeles has become a city where there is no central location to protest, thus providing a mobile network of places of protest.
There is also a change in unionizing, with the changing demographics of increasing immigrant workforce populations. In understanding that Los Angeles has no central place to protest, we can come to a conclusion that this is related to the influences in the many different protests. Even though there is changing demographics, there is a common trend in media and police reaction. Due to the fact that there are no central locations, protests become harder to manage and where to find them becomes a burden to demonstrators trying to rally as well. The media and the police both become nodes of reaction.

Sunday, April 15, 2012

Lab 2

Randy Mai

UID: 203689788

April 10, 2012

Geography 7

LAB 2

1. What is the name of the quadrangle?

Beverly Hills Quadrangle

2. What are the names of the adjacent quadrangles?

Canoga Park, Van Nuys, Burbank, Topanga, Hollywood, Venice, & Inglewood

3. What was the quadrangle first created?

1995

4. What datum was used to create your map?

North American Datum of 1927 (NAD 27), North American Datum of 1983 (NAD 83), & National Geodetic Vertical Datum of 1929

5. What is the scale of the map?

1: 24,000

6. At the above scale, answer the following:

a. 5 centimeters on the map is equivalent to how many meters on the ground?

5 cm on map = 1200 m on ground

b. 5 inches on the map is equivalent to how many miles on the ground?

5 inches on map = ~1.894 miles on ground

c. One mile on the ground is equivalent to how many inches on the map?

1 mile ground= ~2.64 inches on the map

d. Three kilometers on the ground is equivalent to how many centimeters on the map?

3 km on ground = 12.5 cm on map

7. What is the contour interval on your map?

20 feet

8. What are the approximate geographic coordinates in both degrees/minutes/seconds and decimal degrees of:

a. The Public Affairs Building

Latitude: 34°4’22”

Longitude: 118°26’15”

b. The tip of Santa Monica Pier

Latitude: 34°0’8”

Longitude: 118°30’

c. The Upper Franklin Canyon Reservoir

Latitude: 34°6’15”

Longitude: 118°24’41”

9. What is the approximate elevation in both feet and meters of:

a. Greystone Mansion (in Greystone Park)

560 ft or 170. 688 mi elevation

b. Woodlawn Cemetery

140 ft or 42.672 mi elevation

c. Crestwood Hills Park

780 ft or 237.744 mi elevation

10. What is the UTM zone of the map?

Zone 11

11. What are the UTM coordinates for the lower left corner of your map?

UTM northing: 3763000m N.

UTM easting: 361000m E.

12.How many square meters are contained within each cell (square) of the UTM gridlines?

1000 m2 contained within each cell

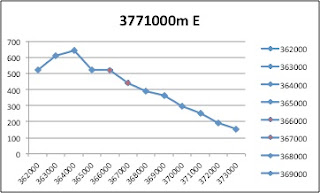
13.Obtain elevation measurements, from west to east along the UTM northing 3771000, where the eastings of the UTM grid intersect the northing. Create an elevation profile using these measurements in Excel (hint: create a line chart). Figure out how to label the elevation values to the two measurements on campus. Insert your elevation profile as a graphic in your blog.


1. What is the magnetic declination of the map?

14° East

2. In which direction does water flow in the intermittent stream between the 405 freeway and Stone Canyon Reservoir?

From north to south

3. Crop out (i.e., cut out and paste) UCLA from the map and include it as a graphic on your blog.


Tuesday, April 3, 2012

2012 CO2 Emissions


2012 CO2 Emissions

(website: http://grist.files.wordpress.com/2010/03/co2-emissions-usa-map-vulcan-project.jpg)
(source: Map courtesy of Purdue University Department of Earth and Atmospheric Sciences)

This map shows the CO2 emissions from fossil fuels in 2002. This data was collected by the Vulcan Project at Purdue University. This gives us a sense of where pollution happens. If we compare this to the population density from the 2010 Census, we can see a correlation. The red and yellow indicates the areas in which pollution happens the most. We can see that CO2 emissions happen primarily in areas where people are most populated. I find this map interesting because Rachel Carson's Silent Spring book hinted at the ongoing pollution that we add to every year. Similar to the 60's people do not realize the impacts of every pollutants. The rise in pollution means more deaths, disease, leads to more uninhabitable places.